
DUCKQUANT / THE QUANT & AI DIRECTORY
Connors RSI(2) — daily reference
Public rule reference · Mean reversion
Documented strategy reference · Classic rule documentation · source checked 2026-10-25
Strategy research profile
Strategy overview
A very short RSI identifies pullbacks while a 200-day average restricts entries to a positive long-term price regime. Recovery above a short average ends the position; this benchmark is the explicitly stated reference convention.
- Strategy style
- Mean reversion
- Rule family
- Mean reversion
- Source platform
- Classic rule documentation
- Source attribution
- Not recorded in reviewed source
- Source example / declared timeframe
- Not recorded in reviewed source
- Benchmark timeframe
- 1D · completed bars
- Primary tested assets
- Bitcoin · GLD gold ETF · QQQ Nasdaq-100 ETF
- Supplementary asset
- Ethereum · Binance spot
- Direction / sizing
- Long / cash · all available cash at entry
- Evaluation window
- 2024-01-01 → 2025-12-31
- Indicator warm-up
- Crypto 2022–2023; ETFs Jun 2021–2023
- Execution
- Next daily open · fractional units
- Initial capital
- 10,000 quote units · USD or USDT
Theoretical basis
A stretched price or oscillator is interpreted as a candidate for recovery toward a local reference. A rolling average is a measurement device, not a known fair value.
Market-regime hypothesis
Recoveries after temporary stretches, provided a persistent adverse trend does not develop.
DuckQuant editorial interpretation of the rule. These mechanisms and regime expectations are hypotheses, not independently established explanations of the measured returns.
Risks and failure modes
A falling market can remain oversold. Averaging reference levels move, and missing or delayed exits can turn a short-recovery idea into long exposure.
- A retrospective two-year window and ETF proxy choices do not establish general robustness.
- Daily-open fills omit order-book depth, lot constraints, taxes and intrabar stop behavior.
- Related rules and identical execution paths are not independent evidence.
Exact rule
Close>SMA200 and RSI2<5 enters; close>SMA5 exits.
Indicators and rule tokens
All thresholds, lookbacks and timing conventions are specified in the exact rule above and the downloadable adapter. Source platform settings do not override this frozen benchmark rule.
Original source
Reviewed source SHA256: bd2bc8c6f9ed02ce50bfd4d009285c8f1a78bef86b367fd96da0cd77d790d23c
Reading and theoretical references
- Reviewed strategy / indicator source ↗
Published rule or indicator reference; adaptation is described separately. - StockCharts ChartSchool: RSI mechanics ↗
Indicator mechanics, not validation of this implementation or its returns.
Adaptation and interpretation
Daily closed-bar signals, next-open all-in long/cash, fixed fees/slippage. Short entries become cash. Source risk sizing, intraday orders, ROI, TP/SL, trailing stops, pyramiding, sessions and protections are NOT native replicas unless explicitly implemented in the stated rule. Source conflict signals resolve to cash. Common indicators are not certified TA-Lib/Pine identical. This teaching source supports the named strategy or indicator. The exact finite entry/exit convention in this record is the DuckQuant reference interpretation, not certification of a full original trading system. For indicator-only sources no claim of a complete published strategy is made.
These are normalized daily long/cash rule tests. They do not reproduce every original platform order, risk control or indicator initialization. Indicator-rule references are explicit interpretations of teaching documentation, rather than complete original published systems.
Standardized backtest results
2024-01-01 → 2025-12-31 · crypto 2022–2023 / ETF Jun 2021–2023 warm-up · 10,000 quote units initial capital · 10 bps fee + 5 bps adverse slippage per side · completed-bar signals, next-open execution.
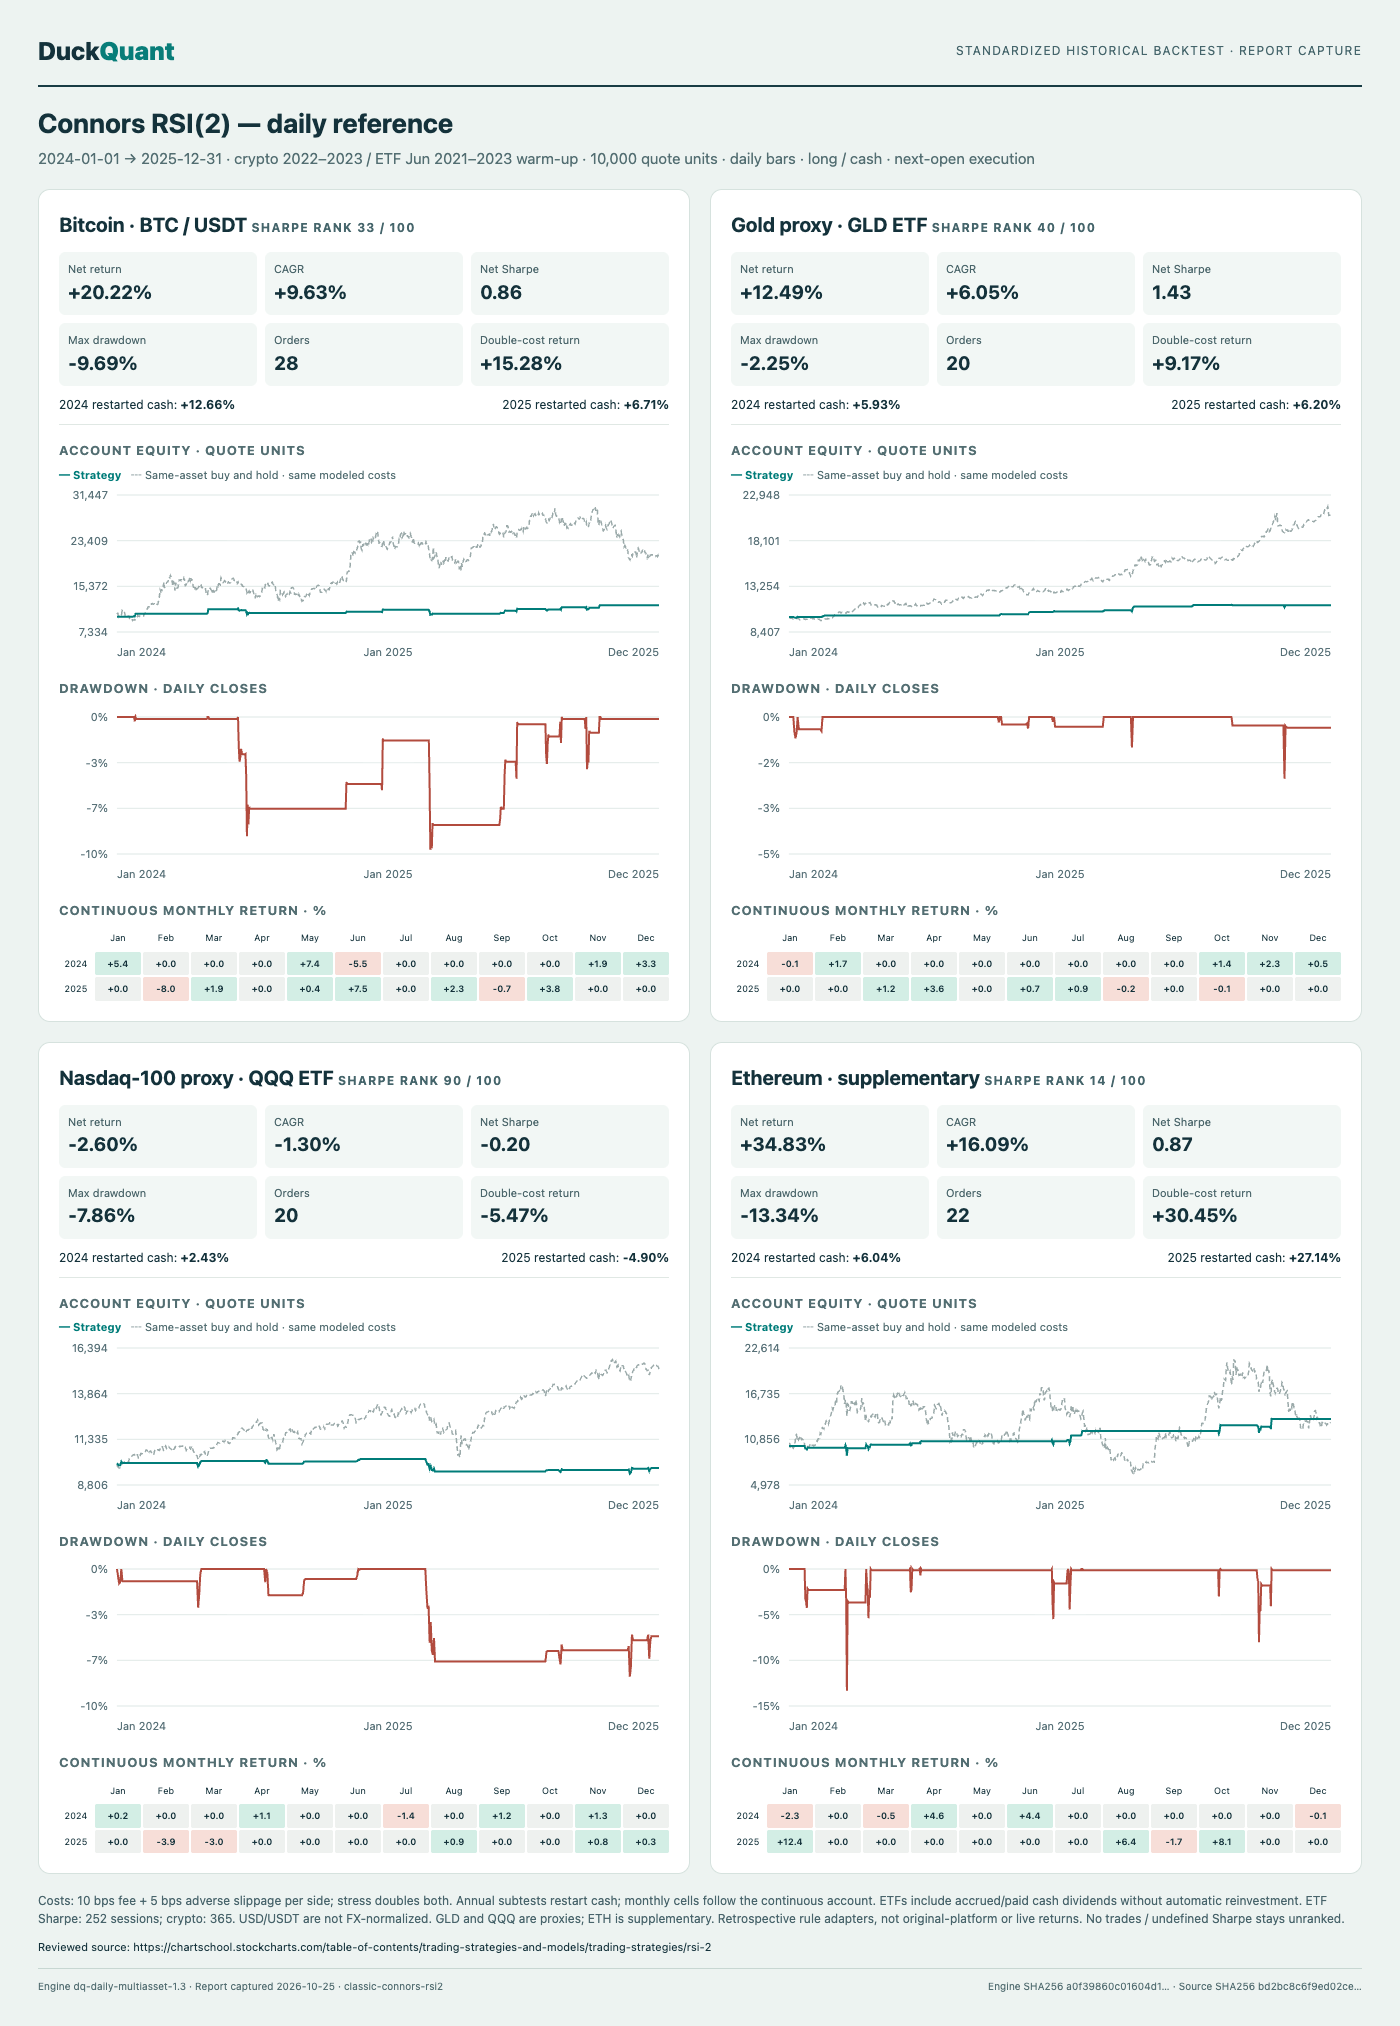
| Asset | Rank / 100 | Net return | CAGR | Max drawdown | Sharpe | Orders | 2024 restarted return | 2025 restarted return | Double-cost return |
|---|---|---|---|---|---|---|---|---|---|
| BTCUSDT | 33 | 20.22% | 9.63% | -9.69% | 0.86 | 28 | 12.66% | 6.71% | 15.28% |
| GLD | 40 | 12.49% | 6.05% | -2.25% | 1.43 | 20 | 5.93% | 6.20% | 9.17% |
| QQQ | 90 | -2.60% | -1.30% | -7.86% | -0.20 | 20 | 2.43% | -4.90% | -5.47% |
| ETHUSDT | 14 | 34.83% | 16.09% | -13.34% | 0.87 | 22 | 6.04% | 27.14% | 30.45% |
Additional measured diagnostics
| Asset | Annualized volatility | Sortino | Calmar | vs buy & hold (pp) | Double-cost drag (pp) | Longest underwater (days) |
|---|---|---|---|---|---|---|
| BTCUSDT | 11.45% | 1.44 | 0.99 | -86.44 | 4.94 | 435 |
| GLD | 4.20% | 3.46 | 2.69 | -93.90 | 3.32 | 133 |
| QQQ | 5.82% | -0.26 | -0.17 | -54.90 | 2.88 | 313 |
| ETHUSDT | 19.15% | 1.52 | 1.21 | 4.99 | 4.38 | 185 |
Metric definitions and unavailable statistics
- annualized volatility
- Sample standard deviation of daily equity returns, including initial cash, multiplied by sqrt(365) for crypto or sqrt(252) for ETFs.
- sortino
- Mean daily return / sqrt(mean(min(return,0)^2)) × sqrt(asset annualization sessions); minimum acceptable daily return 0; N/A without downside.
- calmar
- Evaluation CAGR / absolute evaluation maximum drawdown; N/A with zero drawdown.
- relative return pp
- Strategy total net return minus same-asset buy-and-hold total net return, in percentage points; not factor-adjusted alpha.
- cost drag pp
- Base net return minus doubled-cost net return, in percentage points.
- longest underwater days
- Longest observed calendar duration from a daily equity peak until a later below-peak close, including initial cash. Unrecovered runs are censored at sample end; closed-market days between observations count as calendar time.
- monthly returns
- Continuous account month-end equity change from preceding month-end (initial cash for first month); differs from yearly cash-restart subtests.
Orders are entry/exit operations. Round-trip win rate, profit factor and trade-level holding periods are not available in the stored run and are not estimated.
Primary coverage: BTCUSDT, GLD gold ETF and QQQ Nasdaq-100 ETF; ETH is supplementary. ETF prices are raw traded USD OHLCV. Dividend entitlements accrue for prior-close holders and settle on official payment dates; paid dividends remain cash until a later entry, with no automatic reinvestment. Sharpe uses 252 ETF sessions or 365 crypto days. CAGR uses 731 calendar days. Gold spot and the Nasdaq-100 index are represented by traded proxies; USD and USDT are not FX-normalized.
Retrospective historical comparison; no sealed out-of-sample validation or future return claim. Read the complete evaluation protocol.
Data and reproduction
GLD gold ETF results · QQQ Nasdaq-100 ETF results · Asset definitions and data conventions
BTC daily equity JSON · ETH daily equity JSON · Source registry · Download engine, data and tests
Strategy identifier: classic-connors-rsi2